My Blog
project part 2
Interactive and static plots of flops in super computers in 2015
Project Part 1
To display the super computer through out the years being used.
Hypothesis Testing
To learn more about hypothesis testing. And for quiz 13.
Bootstrapping
Boot strapping and confidence intervals Based on chapter 8 of ModernDive. Code for quiz 12.

Sampling
Based off chapter 7 ModernDive. Code for quiz 11.
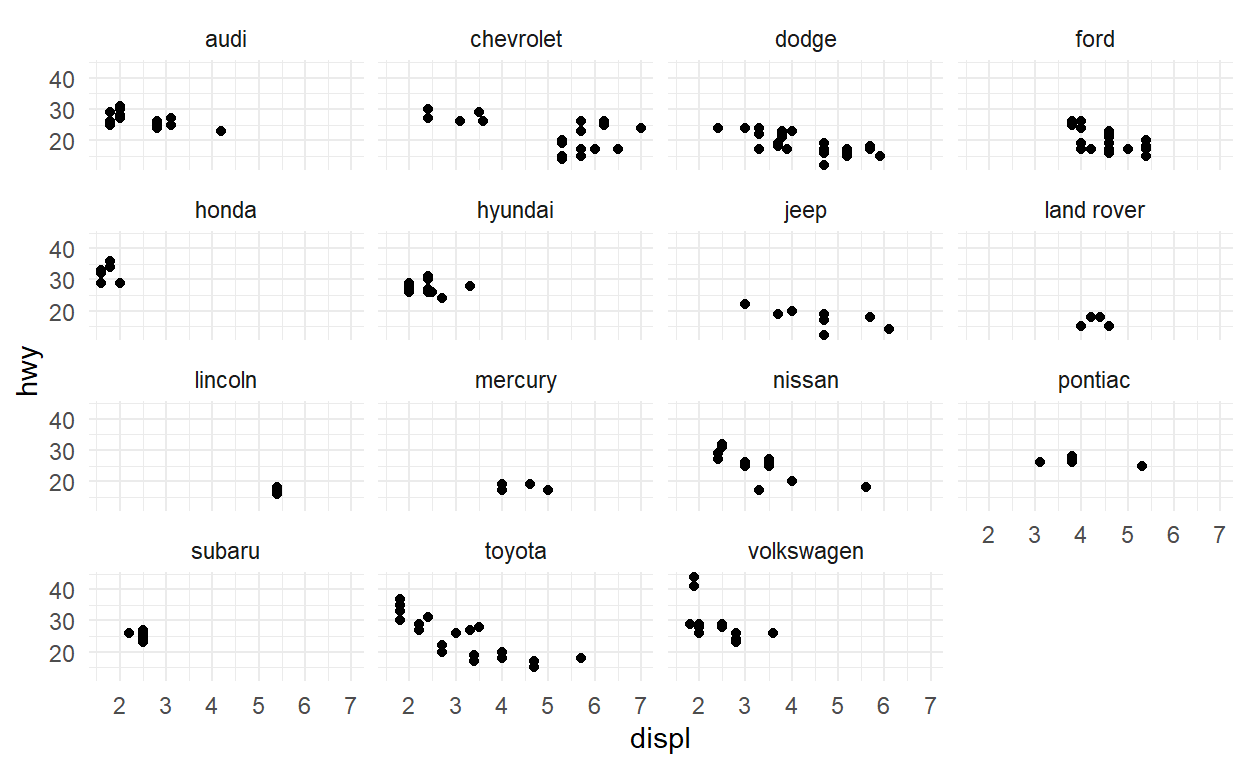
Data Visualization
A way to use the different types of graphs and using new library functions to be able to preform the new data graphs.
Exploratory Analysis II
To look at the different types of graphs that could describe the analytics in the forms of graphs
Joining Data
Code for Quiz 6, more dplyr and our first interactive chart using echarts4r
Data Minipulation
Code for quiz 5 and more practice with dyplr functions
Reading and writing data
Introduction to dpylr
Code and text for Quix 3
Summary Statistics
Comparison of R and Excel